The increasing availability of real-time positional satellite data, poses several interesting questions. Is it possible to predict the most likely berth of arrival given an initial set of coordinates and the berth of departure? How much information is needed before such a prediction can be trusted? If such predictions proved accurate, is it possible to aggregate the predictions by segments, i.e. LNG, to say something about the supply and demand of the segment market?
These question formulations allude to the use of supervised machine learning techniques in the search of answers. Maritime Optima possesses an historical AIS database for more than 75,000 vessels compiled from some 700 satellite and terrestrial AIS receivers. As such, through the use of data engineering techniques, a labeled training dataset can be constructed. Such an approach has previously been implemented, see for example [1].
Central to the construction of the training dataset is the definition of a starting point and an ending point of a vessel trajectory. A natural definition choice would be to use the concept of berths. This, however, requires a complete database of all of the world's berths with additional information such as the type of vessels the berths can harbor. This blog post explains some of the things to consider when identifying berths of different segments which will be used in the construction of a machine learning training dataset.
Port and terminal data are easily available from sources like UNECE and the Global Energy Observatory (in the case of LNG terminals). However, a complete berth polygon database is harder to come by. The Port of Rotterdam is one of the few exceptions with their publicly available Havenkaart.
Using DBSCAN
When trying to identify berths, it makes sense to look at locations where vessels remain stationary for a longer amount of time. This equates to an unsupervised clustering problem. To tackle this, the DBSCAN algorithm was chosen as it easily integrates with the use of the Haversine distance. A detailed description of the algorithm is beyond the scope of this blog post, but a good explanation can be found here.
The first step was to extract historical AIS information for LNG vessels from Maritime Optima's database. This would ensure that the identified berths will only include LNG berths.
Next, the positional vessel data was aggregated hourly. Missing values were linearly interpolated as this rough estimation generates accurate data at locations where a vessel remains stationary.
Initially, the algorithm was run on each vessel with a minPts of 4 and an $\epsilon$ of 50. Conceptually, this will locate all points where a vessel has remained within a radius of 50 meters for more than 4 hours. This resulted in some 22,000 points, and the results can be seen below.
A couple of interesting observations can be made from this picture of the port of Ras Laffan in Qatar. First, the approach correctly identified the LNG berths. Second, it incorrectly identified areas of congestion as LNG berths. Third, it incorrectly identified dry docks as LNG berths.
Clearly, further processing of the data was required. To this end, the variation of the vessel heading proved to be a distinguishing feature between the actual berths and the areas of congestion. This information is also available in the AIS signals. Whereas vessels at berth are moored in a locked position, vessels in congested areas are free to drift and rotate along its center axis.
A threshold was set to a variation ratio of 0.5, as this value was found to eliminate most of the false positive LNG berths due to congestion while still correctly identifying the true positives. Clusters that did not meet the threshold were removed before further analyses.
If we look closer at the satellite pictures of the LNG berths, we can see that there is a lot of jitter around the actual berths. To remove this, and to get a single point for each berth, the DBSCAN algorithm was run again. This time with a minPts of 3 and an $\epsilon$ of 50. Conceptually, this means that we need positional vessel clusters from at least three different vessels at a berth before identifying it as a berth. This resulted in around 240 identified berths, some of which were dry docks and shipyards.
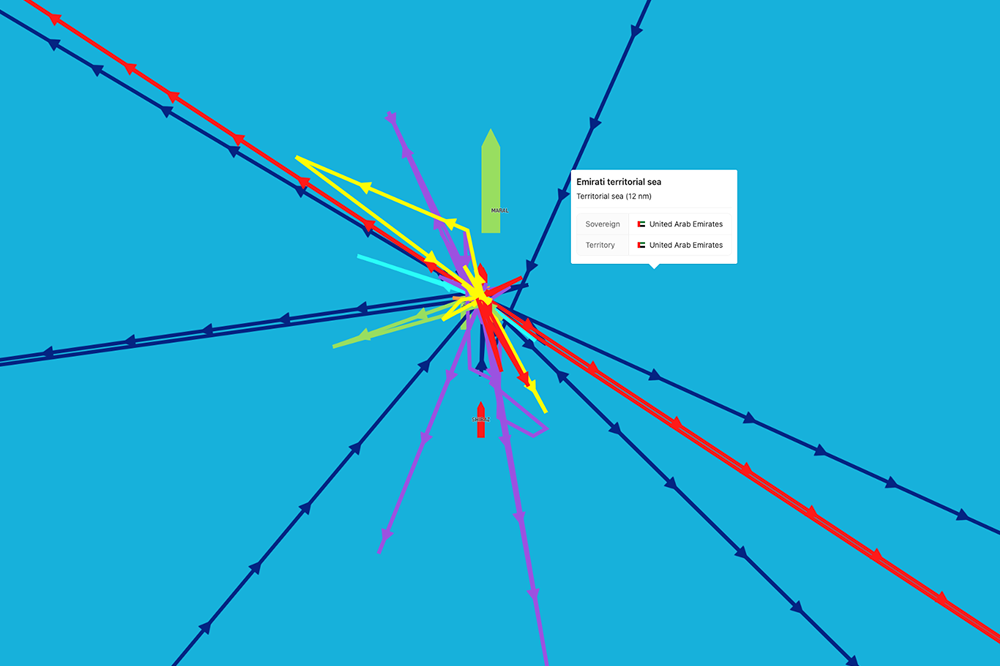
Using the heading and the AIS sender positional data from the AIS signals, it was possible to draw polygons for the identified berths. These polygons are shown below.
Validating the Data
Although the above mentioned approach managed to correctly identify around 190 LNG berths, it was difficult to distinguish between areas used for ship repair such as dry docks and actual LNG berths. As there are a limited number of such places, it made sense to manually build a separate database by using tools such as QGIS. The Ras Laffan dry dock can be seen below.
A second consideration is related to berths in which there has not been observed three different vessel clusters. Such an example can be seen in the port of Bintulu, Malaysia below. As there is only one vessel cluster for this berth, there is no way to distinguish between this single point and some arbitrary other vessel cluster one the open sea using DBSCAN. However, as the Maritime Optima AIS database is updated in real-time, by executing the procedure outlined in this blog post at some future point in time when more AIS data has been accrued, this berth will also be correctly identified.
Conclusion
This blog post has outlined a process for identifying LNG berths from Maritime Optima's historical AIS database. This information is valuable as it helps define a start and end point for a vessel trajectory. From this, a vessel trajectory database can be built and used as a training set for a supervised machine learning model. Such a model could help answer questions related to trade flows and the supply and demand of specific segment markets.
References
[1] M. D. Arifin, K. Hamada, N. Hirata, K. Ihara, and Y. Koide, “Development of ship allocation models using marine logistics data and its application to bulk carrier demand forecasting and basic planning support,” Journal of the Japan Society of Naval Architects and Ocean Engineers, vol. 27, no. 0, p. 139–148, 2018.